My Play Habits: A Data Visualization
This project involved tracking my play habits over a period of ten days. First, I sorted my play activities into different categories, such as play during my leisure time, play where I experienced a flow state, play during work time, play that happened alone, and play that happened with others. To visually represent these categories, I used shapes.
Next, I tracked my feelings associated with each play activity by assigning a height or shape number to each shape. I used three shapes to represent a negative experience, five shapes for a neutral experience, and seven shapes for a positive experience.
To further categorize the type of play, I assigned colors to each category. I used red to represent physical play, orange for social play, yellow for constructive play, green for fantasy play, and blue for games with rules.
Finally, I used Procreate to handwrite and doodle my information, giving the data chart a playful and childlike look. This project involved tracking my play habits using shapes, colors, and handwritten notes in Procreate, allowing me to analyze and understand my play experiences more clearly.
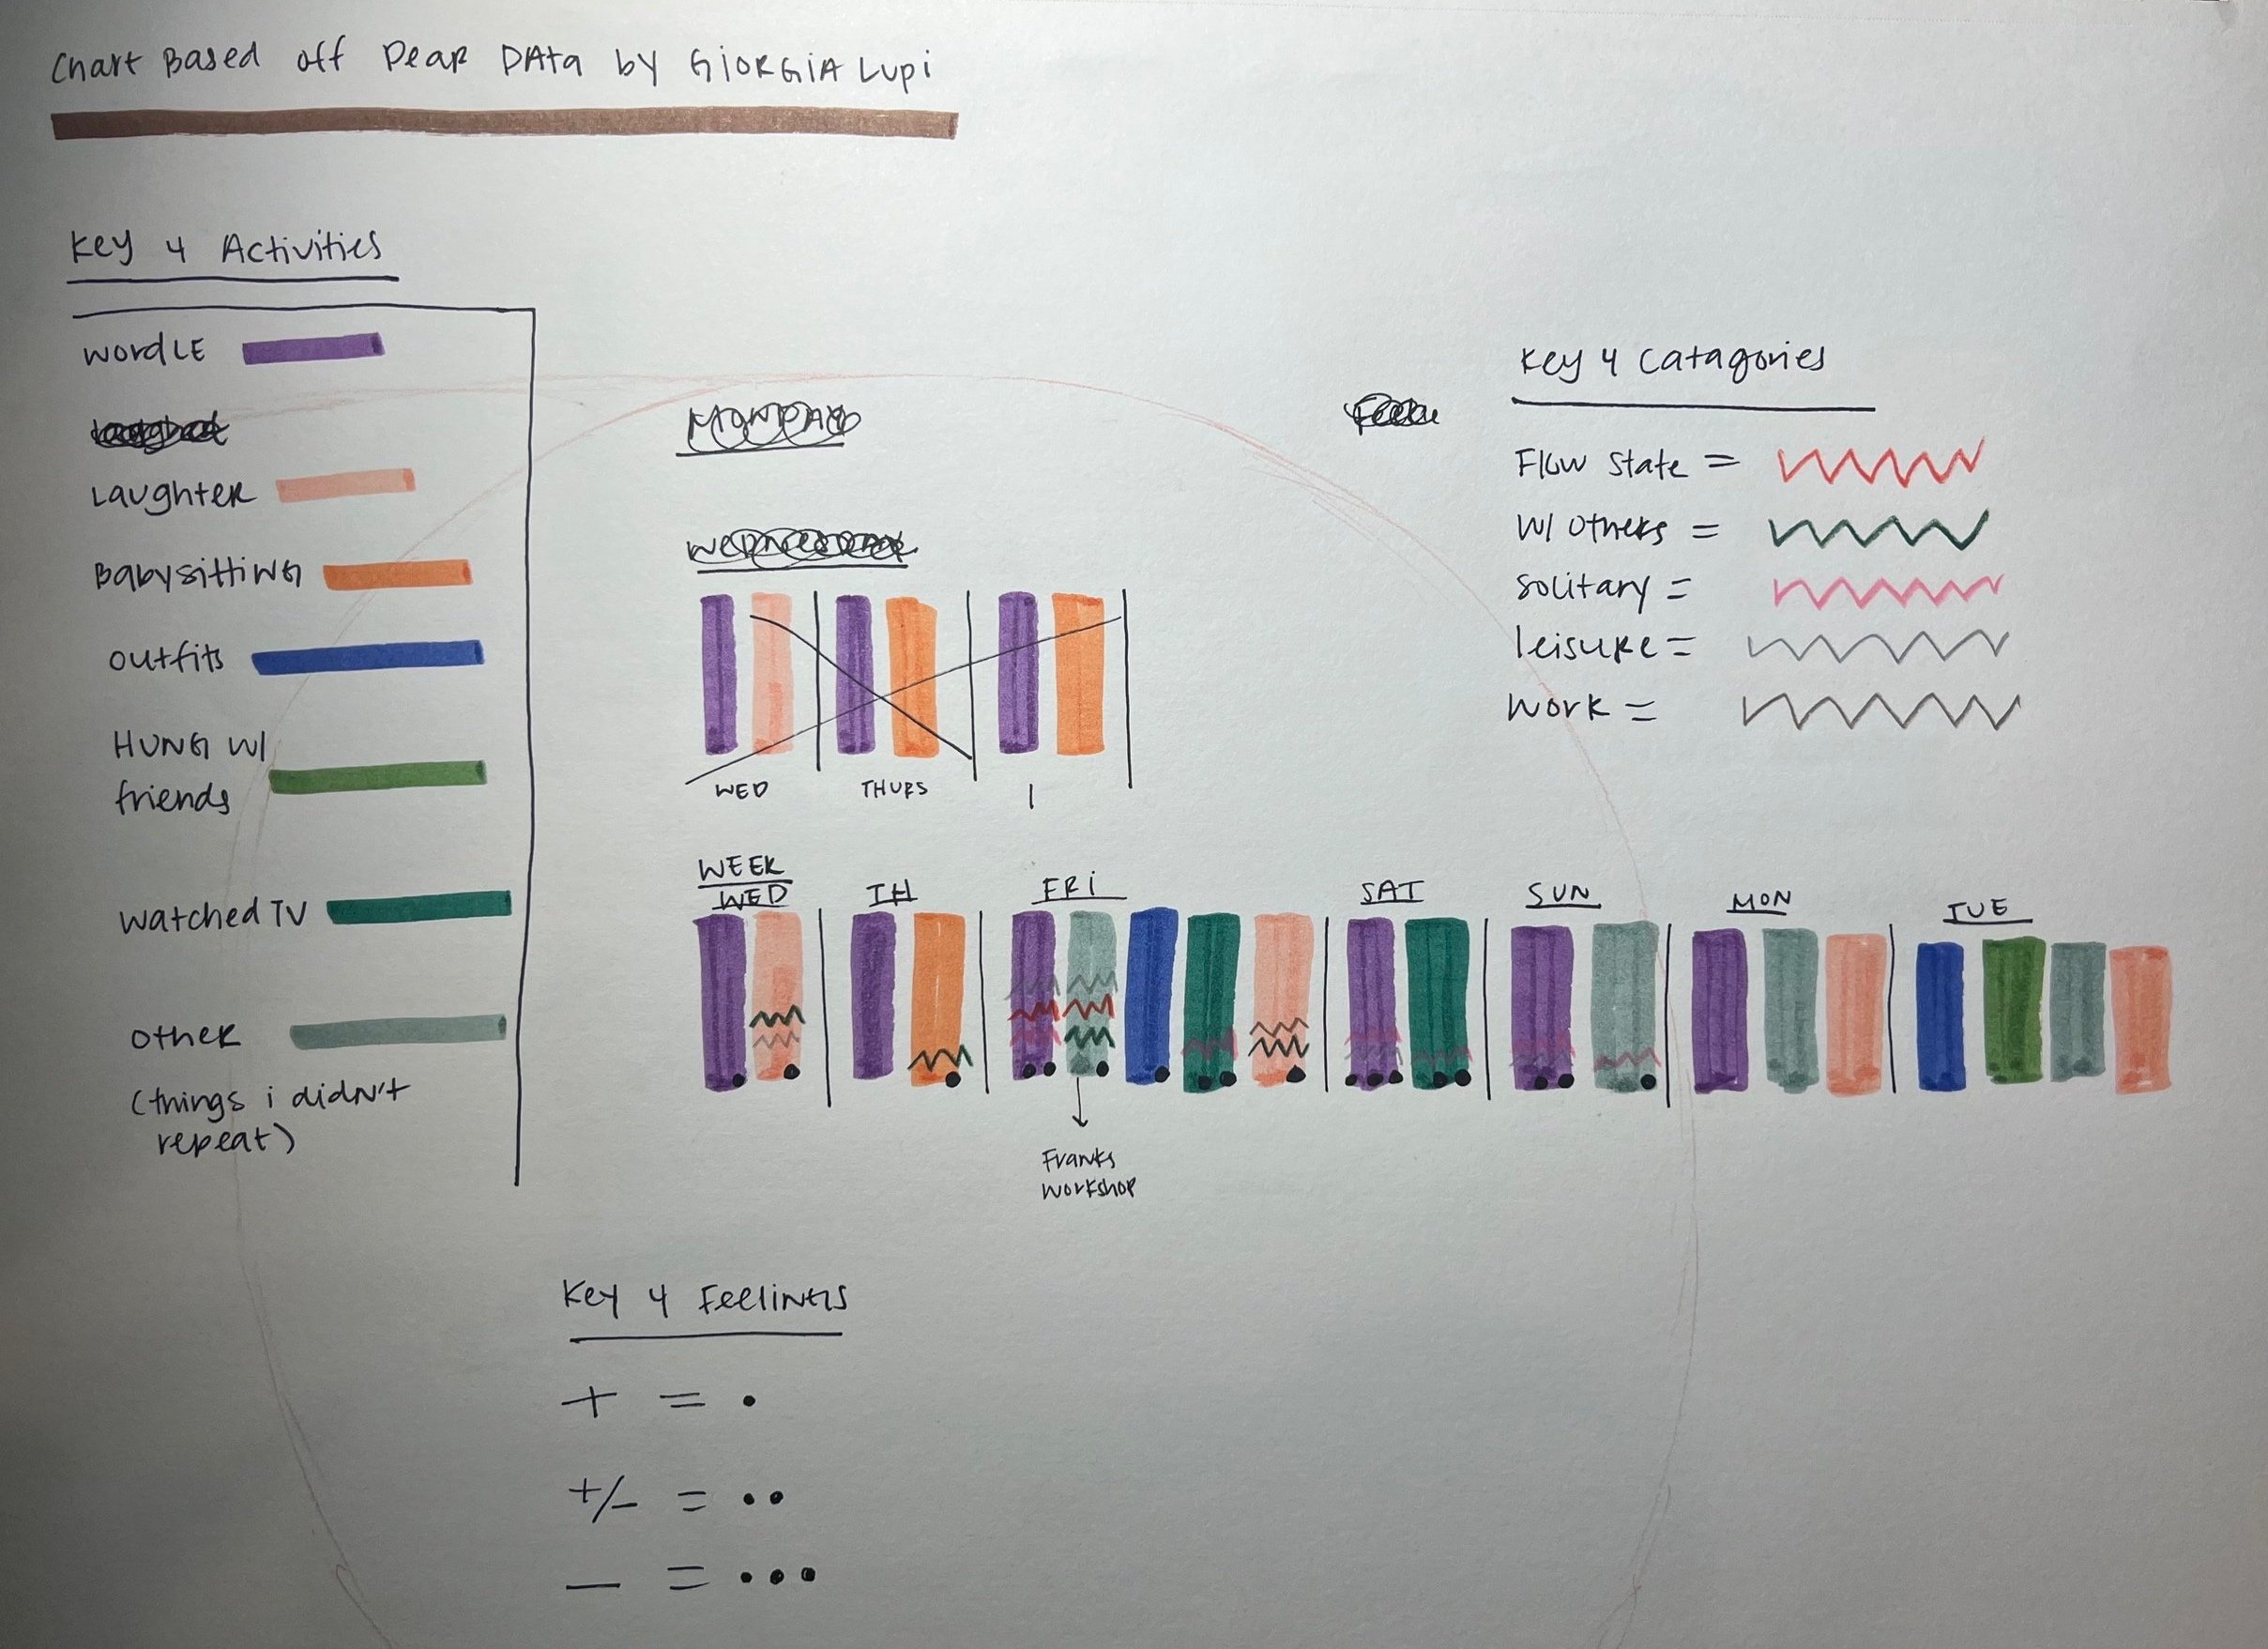
Process Sketches